
Using 2019 full-year Medicare FFS data and the latest data from American Community Survey (ACS), this analysis explores the relationship between SDOH factors and common care utilization and outcome metrics at the county-level. Learn more about this topic from this blog here!
How to use this dashboard
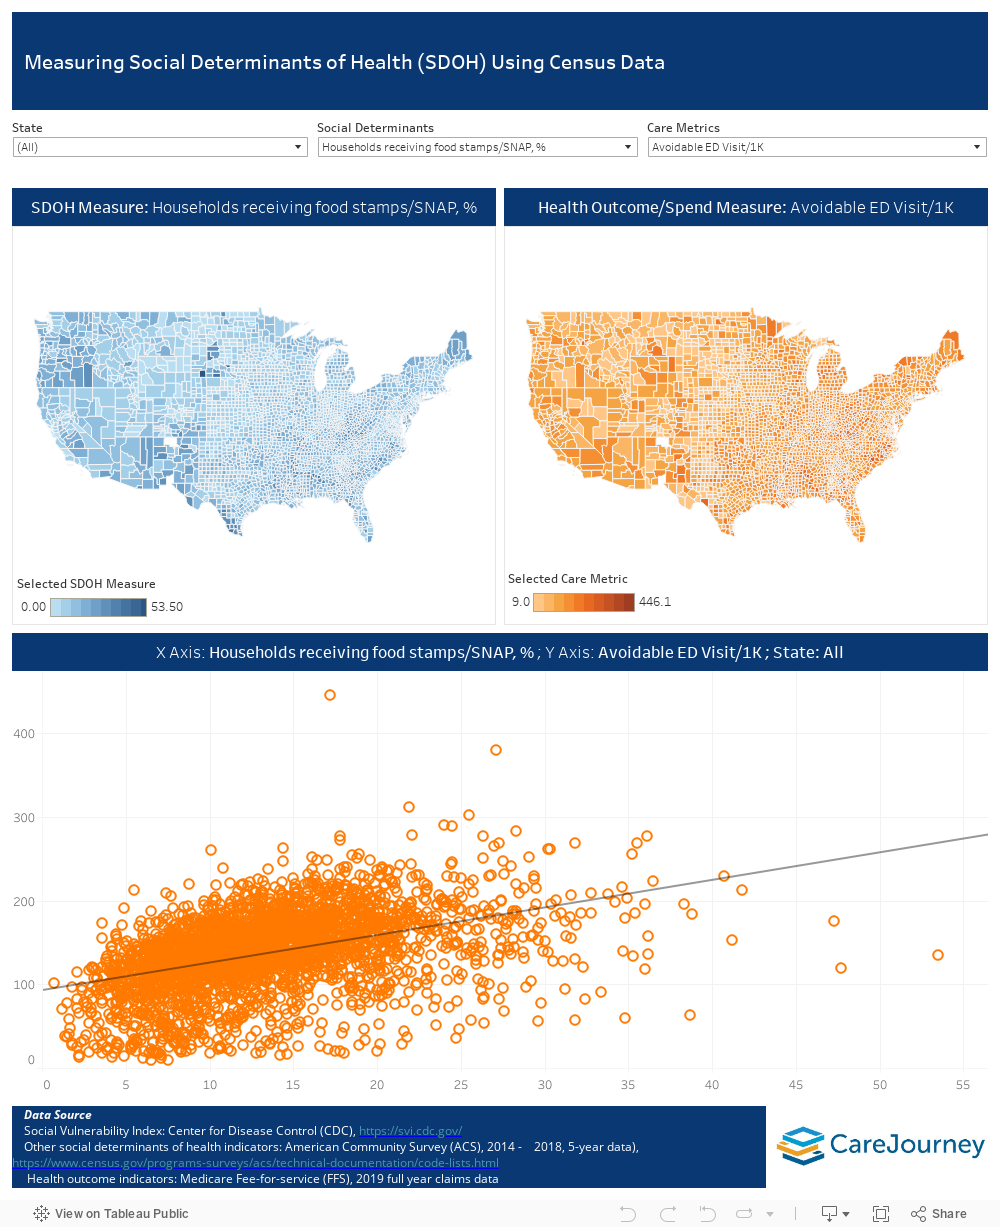
Choose your variables of interest using the state, social determinants, and health filters. Toggle over the map to see the breakdown of county-level data in the tooltip. The scatter plot chart maps the trend line of your chosen social determinant and health measures.
Q: What is the definition and data source of each variable in the analysis?
A:
Social Vulnerability Index (SVI) – Sourced from the Center for Diseases Control and Prevention (CDC). The Index is generated using 2014 -2018, 5-year ACS results. The index is developed to help emergency response planners and public health officials identify and map communities that will most likely need support before, during, and after a hazardous event For more information. Click here.
Median family income - Sourced from 2014 - 2018, 5-year ACS results. Click here for more information on the codelist and how ACS collects data.
Percent of households living below the poverty - Sourced from 2014 - 2018, 5-year ACS results. Measures the percent of households living under Federal Poverty Line (FPL). Click here for more information on the codelist and how ACS collects data.
Unemployment Rate – Sourced from 2014 - 2018, 5-year ACS results. Measures the percent of population over 16 year-old and unemployed. Click here for more information on the codelist and how ACS collects data.
Percent of population aged 25 years and older with at least a high school diploma – Sourced from 2014 - 2018, 5-year ACS results. Measures percent of population aged 25 years and older with at least a high school diploma. Click here for more information on the codelist and how ACS collects data.
Percent of population aged 25 years and older with less than 9 years of education – Sourced from 2014 - 2018, 5-year ACS results. Measures percent of population aged 25 years and older with less than 9 years of education. Click here for more information on the codelist and how ACS collects data.
Percent of occupied housing units with no vehicle available – Sourced from 2014 - 2018, 5-year ACS results. Measures percent of occupied housing units with no vehicle available. Click here for more information on the codelist and how ACS collects data.
Percent of occupied housing units with more than one person per room – Sourced from the raw dataset of SVI which is scraped from 2014 - 2018, 5-year ACS results. Measures percent at household level (occupied housing units), more people than rooms estimate. Click here to read the data dictionary of SVI.
Percent of Population who can’t speak English well – Sourced from the raw dataset of SVI which is scraped from 2014 - 2018, 5-year ACS results. Measures percent of population who speak English "less than well". Click here to read the data dictionary of SVI.
Percent of households receiving food stamps/SNAP – Sourced from 2014 - 2018, 5-year ACS results. Measures percent of households receiving food stamps/SNAP. Click here for more information on the code list and how ACS collects data.
Asthma/1K – Per 1000 beneficiaries, the number of beneficiaries with asthma defined using the Chronic Conditions Warehouse (CCW) Chronic Conditions Algorithm
Diabetes/1K – Per 1000 beneficiaries, the number of beneficiaries with diabetes defined using CCW Chronic Conditions Algorithm
Hypertension/1K – Per 1000 beneficiaries, the number of beneficiaries with hypertension defined using CCW Chronic Conditions Algorithm
Lung Cancer/1K – Per 1000 beneficiaries, the number of beneficiaries with lung cancer defined using CCW Chronic Conditions Algorithm
Avoidable ED/1K – Avoidable Emergency Department (ED) visit per 1000 beneficiaries.
Avoidable ED visit is defined using the original NYU Avoidable ED algorithm. According to the primary diagnosis code, each claim is given the probability that falls into one of the following classifications:
Non-emergent — visits that did not require immediate medical care within a 12-hour window
Emergent — primary care treatable: visits that required care within a 12-hour window that could be effectively treated within a primary care setting
Emergent — preventable/avoidable: visits that could have been prevented through appropriate primary care management (e.g., medication adherence for diabetes)
Emergent — not preventable: visits that required emergency care which could not be prevented
Readmission/1K – Readmission per 1000 beneficiaries. Readmission is defined as an unplanned admission for any cause to an acute care hospital within 30 days of discharge.
PMPY – The total cost of care, per member per year (PMPY)
Q: Where can I access the data table of this analysis?
A: Please reach out to your main point of contact at CareJourney for more information and/or additional support regarding this analysis. If you do not have a main point of contact at CareJourney, please reach out to jumpstart@carejourney.com.


Should you have any additional questions, please reach out to your main point of contact at CareJourney for more information and/or additional support regarding this analysis. If you do not have a main point of contact at CareJourney, please reach out to jumpstart@carejourney.com.
If you want to access more content like the one above, click here.
CareJourney is a leading provider of clinically-relevant analytics for value-based networks supporting leading payer, provider, and life sciences organizations across the US. We help these organizations achieve their goals by bringing new, high value insights out of expansive population claims data.