

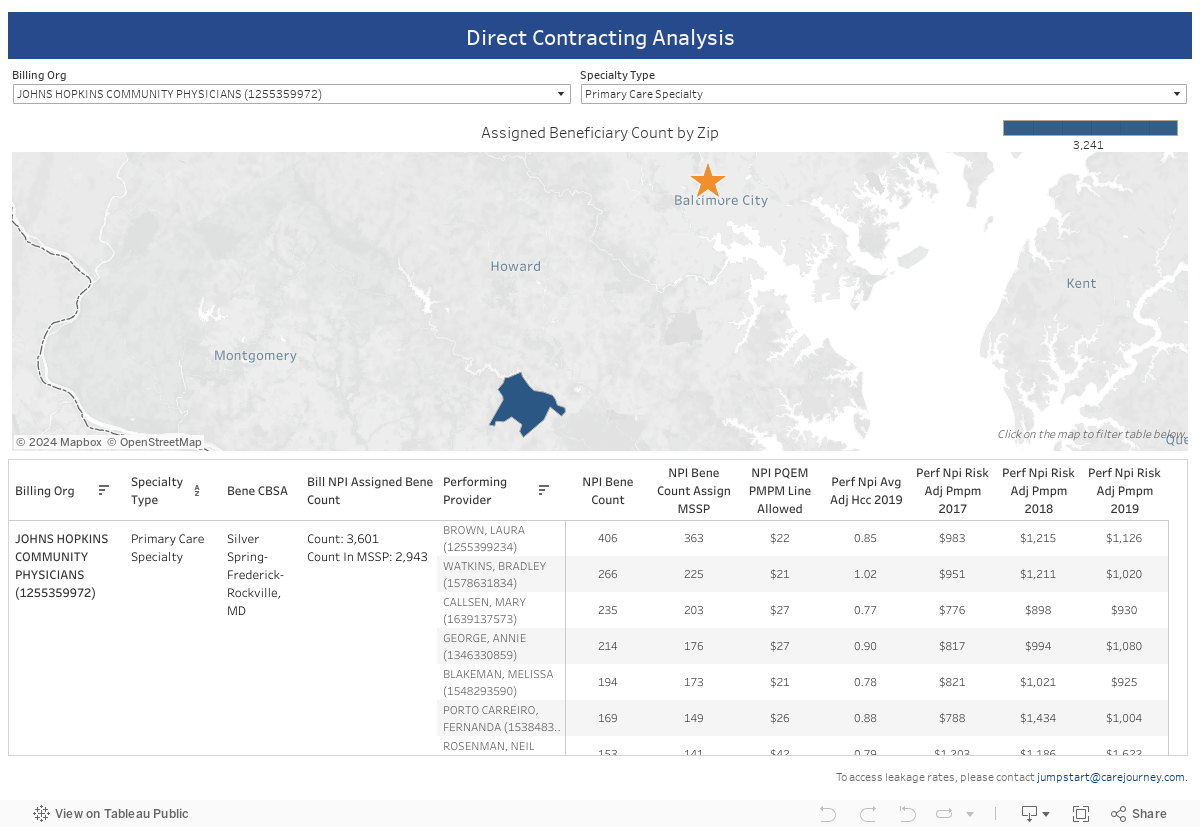
Using the dashboard below, select Billing Organization(s) for the provider(s) or organization(s) that you are interested in.
Hover over the dashboard to see the calculations methodologies for a respective organization/provider.
How recent is the data that powers this analysis?
The dashboard has been updated to include full calendar year 2019 claims data.
How can I estimate a historical baseline?
Once you choose the provider or organization that you're interested in reviewing, please use the following calculation to project the historical baseline. (10% x 2017 PMPM) + (30% x 2018 PMPM) + (60% x 2019 PMPM)
How do you handle risk adjustment if CMS has not yet published information on how they will risk adjust?
We have used annual HCC risk scores to risk adjust PMPM for 2017-2019 for your historical trends. We have also provided raw 2017-2019 PMPM numbers without risk adjustment in the tooltips for additional analyses.
Does the analysis align beneficiaries on a full 24 month enrollment or do you also do partial enrollments?
Beneficiary alignment is based on the full 24 month enrollment, July 2017 - June 2019.
Why is the MSSP and DC attribution beneficiary count different?
The Direct Contracting Beneficiary count is made up of both primary and non-primary care providers based on the 10% threshold and the allowed charges are compared to each other. On the other hand, the MSSP counts leverage the standard two-step process based on a non-weighted plurality of allowed charges (at NPI level). The MSSP Counts is included to show you how many of your current MSSP patients will move over with you assuming you enter into a DCE.
What is PQEM PMPM and what is it used for?
PQEM stands for Primary Care Qualified Evaluation & Management and the metric is the PMPM cost per provider for Primary Care services rendered. Members are leveraging this metric to understand the primary care capitation option.
I noticed that your dashboard seems to have shifted beneficiaries slightly - is that expected?
As part of the update with full year 2019 data and the inclusion of additional metrics (risk adjustment scores as well as risk adjusted PMPM values), we have updated our CBSA mappings to be more specific. As part of that, beneficiaries in a larger CBSA may have been adjusted to a more specific CBSA and alignment may have shifted slightly.
I'm looking for leakage rates but I don't see them in the analysis - can CareJourney help me?
Yes - please reach out to jumpstart@carejourney.com to discuss your leakage needs.
Why does the provider I’m looking for not show up in the dashboard. How do I get their data?
If the provider has less than 100 beneficiaries aligned to them, they will not show in the dashboard. For further information please reach out to jumpstart@carejourney.com

"There was a lot of collaboration in creating this packet of market analytics, looking at which metrics would make the most sense to track. CareJourney’s process of pulling this data into a multi-layered, visual user interface replaces the manual effort previously required by our analytics team."
Mallory Cary, ACO Operations DirectorWe have a large library of similar JumpStart data and custom analysis with in-depth commentary and insights on various healthcare topics.
Get access to more JumpStart dashboards to see how impactful our dataset is and what it can do to inform strategic business decisions for your organization.
CareJourney is a leading provider of clinically relevant analytics for value-based networks supporting leading payer, provider, & life sciences organizations.
Learn more about how we help organizations achieve their goals by bringing new, high-value insights out of expansive population claims data.